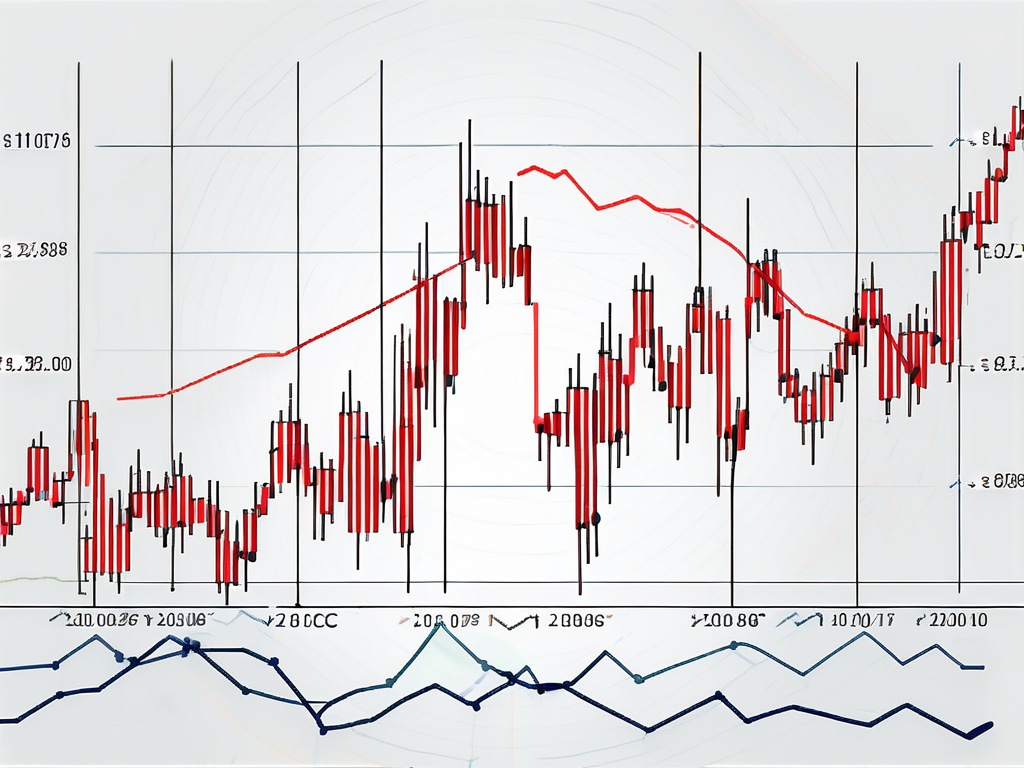
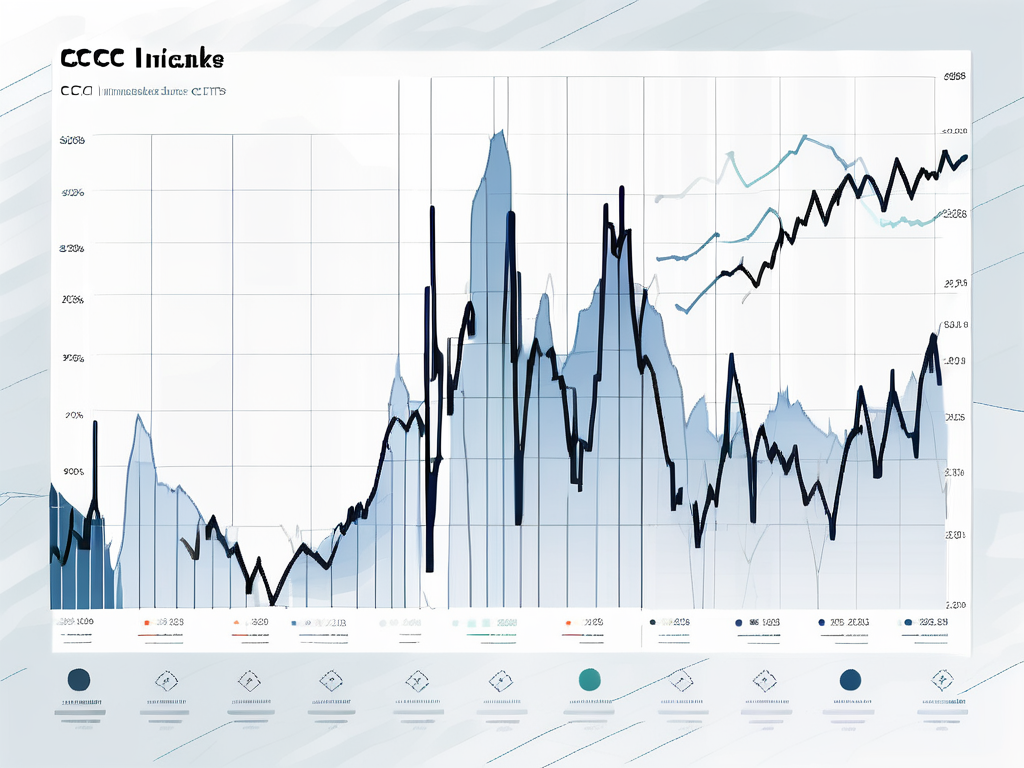
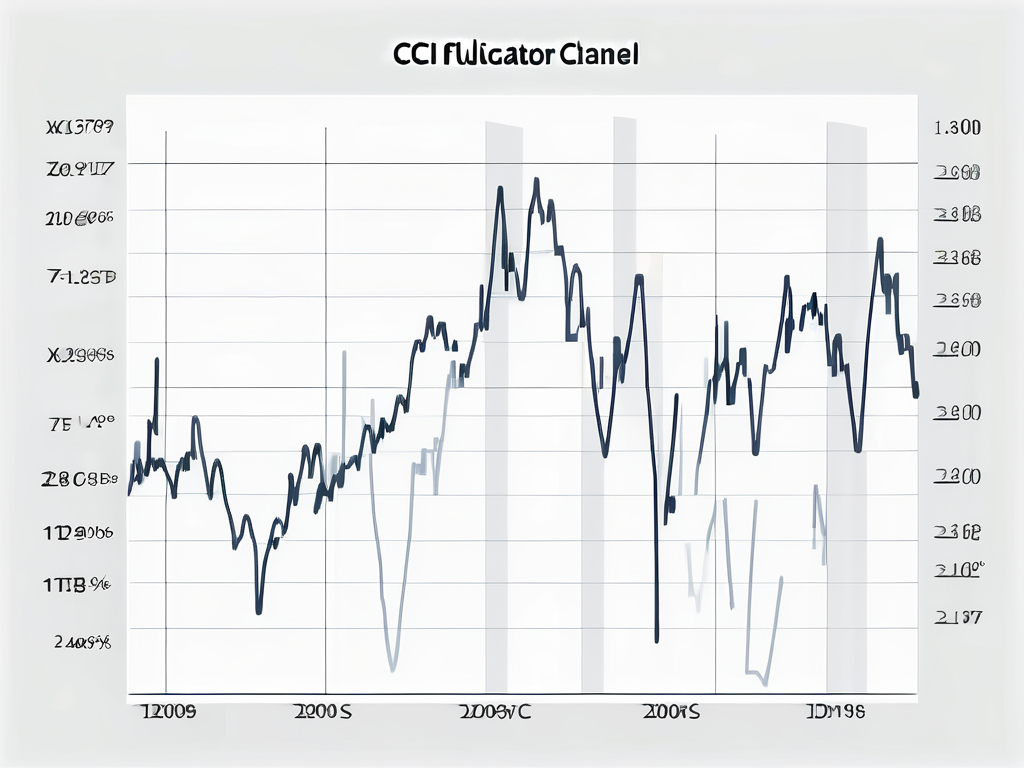
What is the CCI indicator? (commodity channel index)
The commodity channel index, commonly known as the CCI indicator, is a popular technical analysis tool used by traders and investors. It is designed to identify price trends and potential trading opportunities in various financial markets. In this article, we will explore the history, basics, and applications of the CCI indicator, as well as its future in trading technology.
The History and Development of the Commodity Channel Index
The CCI indicator was developed by Donald Lambert in the late 1970s as a way to measure deviations from the average price. Lambert, a commodity trader, wanted to create a tool that could help identify overbought and oversold conditions in the market. After extensive research and testing, he introduced the CCI indicator, which quickly gained popularity among traders.
The CCI indicator is based on the principle that prices tend to revert to the mean over time. It measures the difference between the current price and its moving average, adjusted for normal price volatility. This calculation allows traders to determine whether an asset is overbought or oversold, signaling potential trend reversals.
One of the key features of the CCI indicator is its versatility. Traders can adjust the time frame and smoothing period to suit their trading style and preferences. This flexibility allows traders to use the CCI indicator in various market conditions, from short-term scalping to long-term trend following strategies.
Moreover, the CCI indicator is not limited to a specific asset class or market. It can be applied to stocks, commodities, forex, and other financial instruments, making it a valuable tool for traders across different markets. The widespread use of the CCI indicator in various trading communities has led to the development of numerous trading strategies and techniques centered around this powerful indicator.
Understanding the Basics of the CCI Indicator
To fully understand the CCI indicator, it is essential to grasp its basic components. The CCI is a versatile technical analysis tool that helps traders identify overbought or oversold conditions in the market. Developed by Donald Lambert in the 1980s, the Commodity Channel Index (CCI) has since become a popular indicator among traders and analysts.
The CCI is calculated using the following formula:
CCI = (Typical Price – Simple Moving Average) / (0.015 * Mean Deviation)
The typical price is the average of the high, low, and close prices of an asset. This calculation method aims to capture the overall price movement of an asset in a single value. The simple moving average (SMA) is the average of the typical prices over a specified period, typically 20 periods. The mean deviation measures the average distance between the typical prices and the SMA, providing insight into the volatility of the asset.
By dividing the difference between the typical price and the SMA by the mean deviation and multiplying it by 0.015, the CCI indicator is normalized and can generate values that range from extremely negative to extremely positive. Traders use these values to assess the strength and direction of a trend, as well as potential reversal points in the market.
Traders can adjust the CCI indicator’s time frame to suit their trading style and objectives. Shorter time frames, such as 14 periods, can provide more sensitive signals, allowing traders to capture short-term price movements. On the other hand, longer periods, like 50 or 100 periods, yield smoother readings, which are preferred by traders focusing on long-term trends and investment strategies.
Using the CCI Indicator for Trend Identification
The primary use of the CCI indicator is to identify potential trends in the market. When the CCI crosses above zero, it signals the potential start of an uptrend, suggesting a bullish market sentiment. Conversely, when the CCI crosses below zero, it indicates the potential start of a downtrend, signaling a bearish market sentiment.
Furthermore, traders use the CCI indicator to identify overbought and oversold conditions. CCI values above +100 are considered overbought, suggesting that an asset may be due for a price correction or reversal. Conversely, CCI values below -100 are considered oversold, indicating that an asset may be undervalued and potentially ready for a price rebound.
It’s important to note that the CCI indicator, like any technical analysis tool, is not foolproof and should not be used in isolation. It is better to use the CCI indicator in conjunction with other technical indicators, such as moving averages or trend lines, to confirm trading signals and increase the probability of successful trades.
Traders often combine the CCI indicator with other momentum oscillators, such as the Relative Strength Index (RSI), to gain a more comprehensive view of market conditions. By using multiple indicators, traders can reduce the risk of false signals and improve their overall trading strategy.
In addition to identifying trends and overbought/oversold conditions, the CCI indicator can also be used to spot divergence. Divergence occurs when the price of an asset moves in the opposite direction of the CCI indicator. This can signal a potential trend reversal, providing traders with valuable insights into market dynamics.
Interpreting CCI Signals for Trading Decisions
When interpreting CCI signals, traders pay attention to the magnitude and duration of the indicator’s movements. Larger positive or negative values indicate a stronger trend, while smaller values suggest a weaker trend or sideways market.

Traders also look for divergences between the CCI indicator and price action. Bullish divergences occur when the price makes lower lows while the CCI makes higher lows, indicating a potential bullish reversal. Conversely, bearish divergences occur when the price makes higher highs while the CCI makes lower highs, signaling a potential bearish reversal.
However, it is crucial to exercise caution when trading based on CCI signals alone. False signals and whipsaws can occur, especially during periods of low volatility or when market conditions are influenced by external factors. Risk management and proper trade sizing are essential to mitigate potential losses.
Moreover, traders often combine CCI signals with other technical indicators to confirm trading decisions. Commonly used indicators include moving averages, relative strength index (RSI), and Bollinger Bands. By cross-referencing multiple indicators, traders can increase the probability of making successful trades.
Another factor to consider when using CCI signals is the timeframe of the chart being analyzed. Short-term traders may focus on intraday charts to capture quick price movements, while long-term investors may rely on daily or weekly charts for a broader perspective on market trends.
It’s also important for traders to stay updated on economic events and news releases that could impact the financial markets. Unexpected announcements such as interest rate changes, geopolitical tensions, or economic data releases can swiftly alter market conditions, affecting the reliability of CCI signals.
Applying the CCI Indicator in Different Markets
While the CCI indicator was initially developed for commodity trading, it is now widely used in various financial markets, including stocks, forex, and cryptocurrencies. Traders can adjust the CCI settings to suit the specific characteristics of each market and asset class.

In stock trading, the CCI indicator can be used to identify potential trends in individual stocks or broader market indices. It can help traders determine whether a stock is overbought or oversold relative to its historical price action, providing insights for potential buy or sell opportunities.
In addition to identifying overbought or oversold conditions, the CCI indicator in stock trading can also be utilized to spot divergences between the indicator and price movements. This can signal potential trend reversals or continuations, offering traders valuable information for making informed decisions.
In forex trading, the CCI indicator can be applied to different currency pairs to identify potential price reversals or trend continuations. By analyzing CCI signals in conjunction with other technical indicators and fundamental analysis, forex traders can enhance their decision-making process and increase the likelihood of profitable trades.
Moreover, in forex trading, traders often use the CCI indicator in combination with support and resistance levels to confirm potential entry and exit points. This strategic approach helps traders establish risk management parameters and optimize their trade setups for improved consistency and profitability.
In cryptocurrency trading, the CCI indicator can assist traders in navigating the volatile and rapidly changing crypto markets. By using the CCI in conjunction with other indicators specific to cryptocurrencies, such as trading volume or blockchain analytics, traders can make more informed trading decisions.
Furthermore, in cryptocurrency trading, the CCI indicator can be particularly valuable during periods of high market volatility. Traders can use the indicator to gauge the strength of price movements and identify potential trend shifts, allowing them to adapt their trading strategies accordingly and capitalize on market opportunities.
The Future of the CCI Indicator in Trading Technology
As technology continues to advance, traders can expect further enhancements and innovations in the field of technical analysis. The CCI indicator has already been integrated into many trading platforms and charting software, enabling traders to access real-time CCI readings and customize their trading strategies accordingly.
Moreover, with the rise of algorithmic trading and artificial intelligence, the CCI indicator can be incorporated into automated trading systems to execute trades based on predetermined criteria and market conditions. This integration allows traders to take advantage of CCI signals without constantly monitoring the markets, potentially improving efficiency and reducing emotion-driven decision-making.
Furthermore, the future of the CCI indicator holds even more exciting possibilities. With the advent of big data and machine learning, traders can expect the CCI indicator to become even more accurate and reliable. By analyzing vast amounts of historical market data, machine learning algorithms can identify patterns and trends that human traders may overlook. This enhanced accuracy can provide traders with a competitive edge in the fast-paced world of financial markets.
Additionally, the CCI indicator is not limited to just one asset class. While it is commonly used in the analysis of stocks and commodities, traders are exploring its potential in other markets such as forex and cryptocurrencies. By adapting the CCI indicator to different markets, traders can expand their trading opportunities and diversify their portfolios.
In conclusion, the CCI indicator is a valuable tool in technical analysis, helping traders identify price trends and potential trading opportunities. By understanding the history, basics, and applications of the CCI indicator, traders can incorporate it into their trading strategies and improve their overall decision-making process.
Note: The information provided in this article is for educational purposes only and should not be construed as financial advice. Trading in financial markets involves risk, and individuals should exercise caution and consult with a professional financial advisor before making any investment decisions.
Ready to enhance your trading strategy? Join TrendCloud Trading today!
At TrendCloud Trading, we offer a comprehensive platform that combines cutting-edge technology with expert analysis to help traders maximize their potential in the financial markets. Our team of experienced professionals is dedicated to providing top-notch education, tools, and support to empower traders at every level. Join us today and take your trading to new heights!
Enhance Your Trading with the TrendCloud Trading System
Ready to take your trading to the next level? Discover the power of the TrendCloud Trading System, expertly designed by Chris Juliano to revolutionize your futures trading experience. With advanced algorithms, real-time data analysis, and a suite of intuitive trading charts, you’re equipped to navigate the markets with confidence. Whether you’re a day trader or a swing trader, the TrendCloud Trading System provides the actionable insights and strategies you need to capitalize on market trends and optimize your trades. Embrace the future of trading with a system that’s built for success. Learn More about how the TrendCloud Trading System can transform your trading journey.

